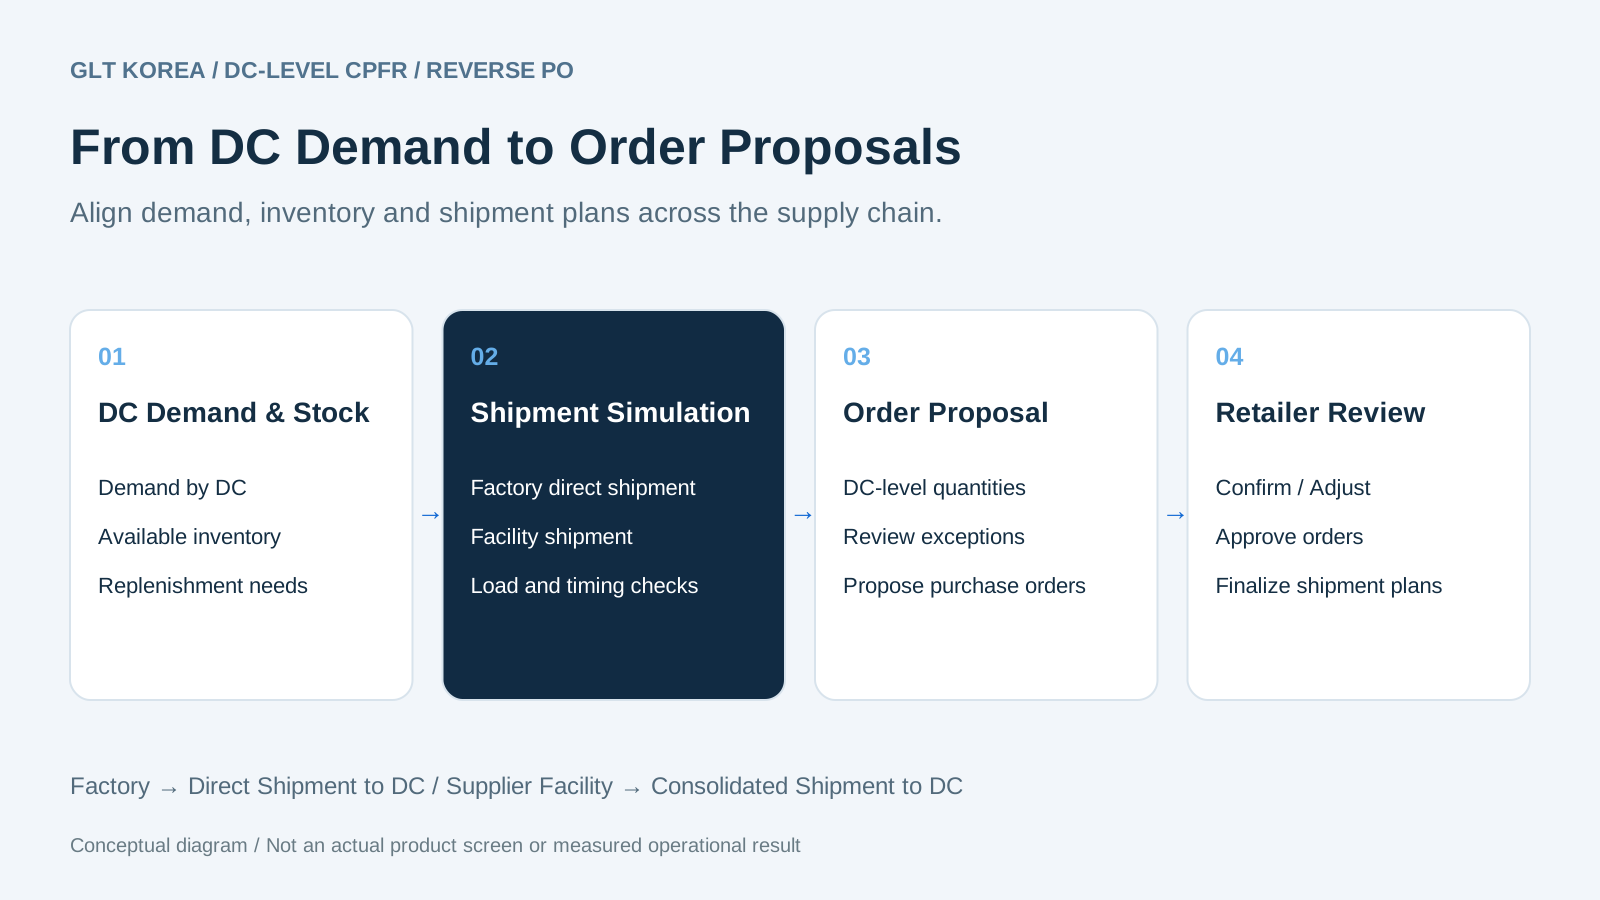
DC unit CPFR is a collaborative method that proposes an order based on the demand forecast and inventory of each distributor's logistics center and the supplier's production and shipment capacity. Reverse PO in this case is a flow in which the supplier first presents an order proposal, the distributor reviews and confirms it, and then issues a purchase order.
Based on past collaborative design data between a global electronics company and a large home appliance distributor, we look at how to connect national demand forecasts to DC-specific ordering and direct delivery plans. The figures below are presented in the data Plan goals and expected effectsand is distinguished from the actual performance after operation.
GLT directly signed the contract and built it from design to operational opening.
GLT Korea signs contracts directly with customers, receives customer requirements, and Independently performs detailed design, development, testing, and operation openingI did it. This is an example of a construction that connects customer demands into actionable business rules and systems.
| step | GLT Delivery Scope |
|---|---|
| Requirements received | Receive business and system requirements presented by the customer and specify the scope of implementation |
| detailed design | Detailed design of work flow and processing rules for DC unit ordering proposals and shipping plans |
| development | System development according to customer requirements and detailed design |
| Test/Open | Perform system testing and proceed with actual operation opening |
The above contract/performance scope and operational opening history are GLT’s confirmed information. We distinguish between construction completion history and actual achievement of the quantitative indicators below.
The prediction was correct, but why are the logistics costs the same?
In this case, in the existing method, even if the entire country's demand forecast was agreed upon, the supplier's distribution of volume by facility and the distributor's actual ordering by DC may not match. The structure is such that suppliers divide shipments based on past history, and distributors order based on their own DC information, resulting in differences in the execution stage.
- Some facilities have leftover inventory, while others need replenishment.
- Smaller orders can be split up, resulting in increased less-than-truckload (LTL) and emergency response.
- Shipping from a facility outside the original area of responsibility may result in additional transportation burden.
The key is not only to increase prediction accuracy, Linking agreed-upon demand to actual orders and feasible shipment bundlesIt is. CPFR itself does not only cover national totals. This project is an example of the collaboration unit at the time being refined to the DC level.
Reverse PO proposed first by the supplier
This is not a method in which the supplier unilaterally decides the inventory of the distributor. It is a collaborative structure in which both parties agree on the sharing scope, inventory standards, and change limits, and the distributor confirms the order by confirming the proposal.
| step | Information and judgment linked to planning |
|---|---|
| 1. Check demand and inventory by DC | Check sales and receipt forecasts, expected inventory, and target weeks of inventory (WOS). The sum of each DC's forecasts is also matched to the agreed overall volume. |
| 2. Priority review of factory direct delivery options | Calculate the amount of direct delivery per DC based on the weekly production plan and load for each product. View the quantity that can be produced and the quantity scheduled to be shipped. |
| 3. Adjustment of shipment allocation for each DC | Identify vehicle-to-truck (FTL) opportunities by rebalancing scheduled allocations per DC prior to shipping. This step is distinct from directing physical inventory movement between distributor DCs. |
| 4. Pull/Push review between parking | While checking available production/inventory and inventory standards, we consider whether to pull in next week's volume or defer part of it. The data suggests adjustment conditions ranging up to 10%. |
| 5. facility shipment of remaining quantity | The remaining quantity after direct shipment from the factory is allocated based on available inventory and DC mapping at the supplier facility. We first review shipments within the region, and then check how to handle single-load, out-of-region shipments, LTL, and remaining volume. |
| 6. Proposal, review, order confirmation | Connects data flows of demand forecasting, production planning, ERP, TMS, and EDI. Materials are designed separately for automatic interface and file upload, and order proposals are reviewed and confirmed by the distributor. |
How should we interpret 75% and 10%?
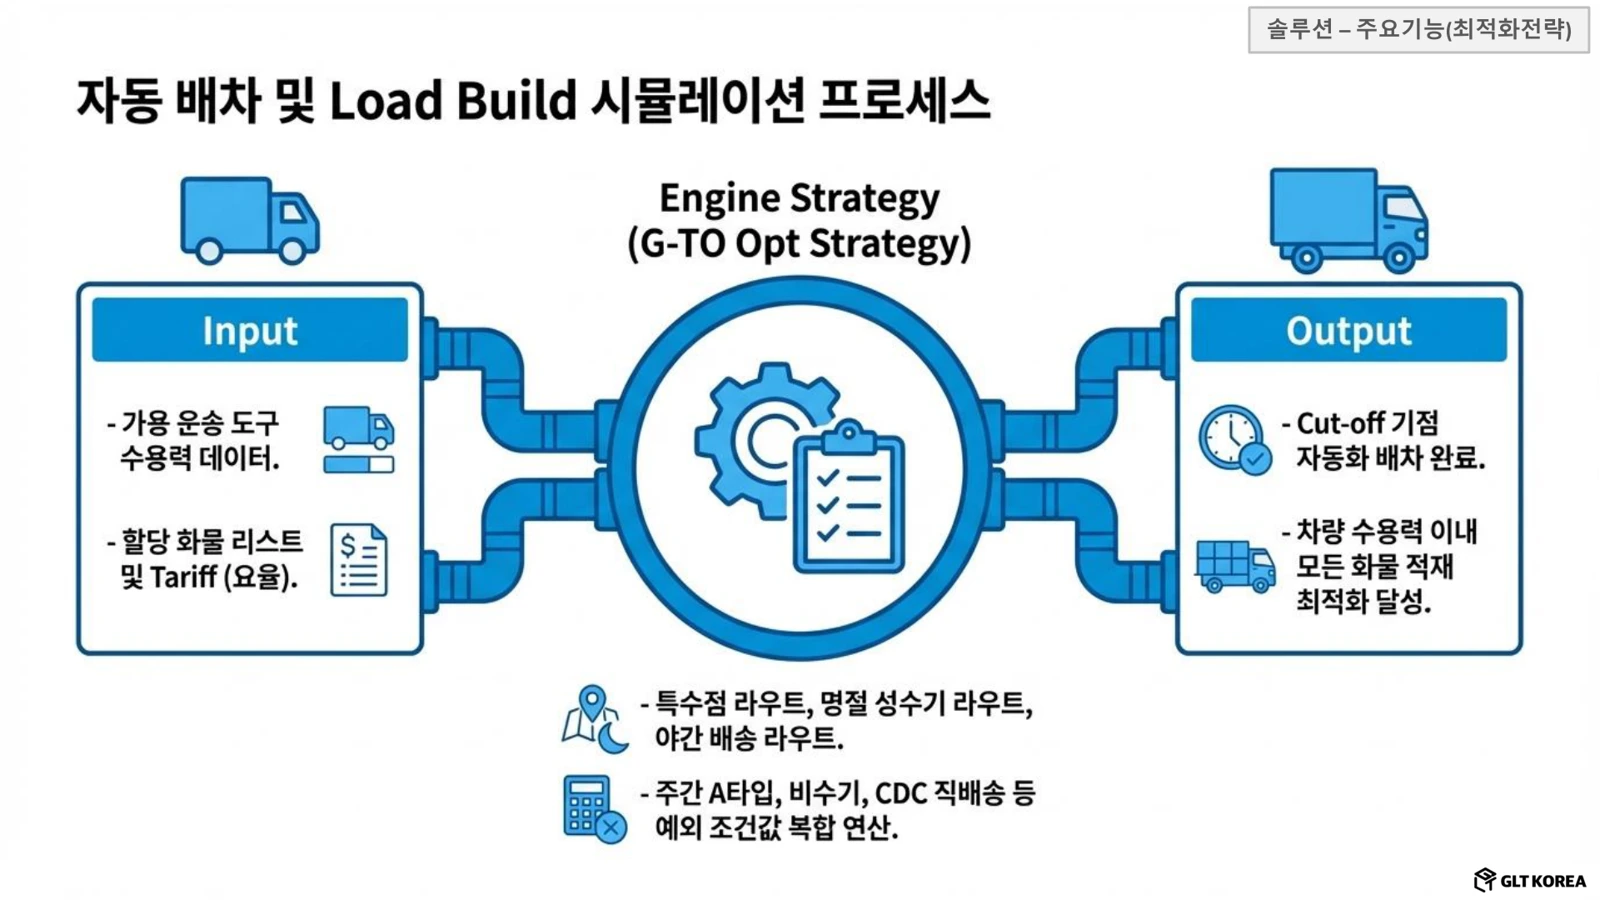
75% is the load review standard in this case. The expected shipment quantity for each product is converted to the maximum loading quantity and added to calculate the loading size, and then used as a standard to determine whether the remaining volume can be configured as an FTL candidate. This rule applies to all industries and does not guarantee that vehicles will always be 100% filled. For actual application, pallet specifications, volume, weight, and delivery conditions must be checked together.
10% is a condition for volume adjustment between parking lots. Apply while checking the allocation for each product, overall forecast, and available quantity for next week. This is not a limit that applies to all DC-to-DC redistribution. After Pull/Push, we re-verify the consistency of DC-specific forecasts and overall totals, final inventory standards, and supply availability.
In addition, the available inventory must first be adjusted to the standard time and the inclusion method of orders scheduled to be in stock and already allocated. Even if the inventory number is the same, the quantity that can be shipped may vary if the definitions for each system are different.
Goals and expected effects presented in the material
| indicators | Based on data | plan goals |
|---|---|---|
| Proportion of factory direct delivery | 40% | 60% |
| Share of light truckload (LTL) | 5% | 3% |
| Proportion of shipments outside the region | 17% | 11% |
| Reduce annual logistics costs | Comparison standard amount not provided | Expected to be about $800,000 to $1 million |
The change in proportion is Targets of +20%p, −2%p, −6%pIt is. Annualized savings are estimates based on shipping performance and forecasts at the time, expected growth rates, and variable costs per unit shipped. It is not translated into savings based on current unit costs or actual achievement rates.
The detailed denominator and collection period for each proportion are not clearly identified in the data. We do not arbitrarily determine the number, volume, or cost ratio or add the indicators together.
The original does not include input/result files and actual operational settlement data to be reproduced with the same orders, vehicles, and constraints before and after. So this post is Examples showing process design and expected effectsThis is not a cost reduction performance table verified under the same conditions.
Both suppliers and distributors have an incentive to save.
In the data, there is also a proposal to reflect 0.15% of the invoice, or approximately $700,000 to $900,000 annually, in benefit sharing and reinvest in joint marketing, etc. In addition to a structure that only reduces transportation costs for suppliers, the system is designed to provide incentives for distributors to participate in information sharing and order coordination.
This is an offer and not a firm contract or actual payments. Because the estimated logistics cost savings and benefit sharing amounts are different estimates and proposals, the net profit is not calculated by simply combining or subtracting the two ranges.
Which companies can you use as a reference?
- Manufacturer/Brand: When you want to reflect the demand for each DC of a large distribution channel in your production/direct delivery plan
- Distributor/multi-center operator: When looking for alternatives to reduce inventory imbalance at each facility, small replenishment, and out-of-area shipping burden
- SCM/logistics planning organization: When you experience a discrepancy between order confirmation and shipment execution while managing forecasts, inventory, and transportation respectively.
Initially, you can review representative products and some DCs by aligning data definitions and order approval procedures. Required data are demand, inventory, and target WOS for each DC, production plan, available inventory at each facility, loading standards for each product, freight rate, lead time, and rules for allowing changes to business partners.
The original schedule presents a plan for process/rule definition → system development/connection → pilot → operation transition. GLT has even carried out the actual opening of operations, but this schedule alone does not confirm the exact start date of operation or ‘completion of 5-month construction’. The introduction schedule should be determined based on data preparation, consultation with business partners, and scope of connection.
Frequently Asked Questions
What is the difference between DC unit CPFR and overall demand forecasting?
The focus is on linking the overall agreed volume to inventory, replenishment, and shipment decisions for each DC. This example presents a structure that refits DC-specific forecasts and overall totals after parking adjustments.
Does Reverse PO mean that the supplier confirms the order?
No. In this case, the supplier proposes an order plan first, and the distributor reviews and confirms the contents and then issues a purchase order. Distinguish between proposal and final ordering authority.
If I want to reduce LTL, do I have to postpone all my shipments to next week?
No. First, we review the possibility of direct shipping, allocation adjustment, facility shipping, and mixed shipping. Exceptions include LTL processing for quantities required due to inventory shortages and delivery conditions, and deferrals are reviewed within allowable conditions.
If I have an existing TMS, can I still review it?
You can review the scope of your data and business connections based on your existing systems. This does not mean that the entire CPFR·Reverse PO flow in this case is a basic feature of the current GLT product, and the actual implementation scope and interface will be confirmed by each customer.
Data and scope of interpretation
We referred to the overall process, objectives, simulation, system requirements, approval procedures and benefit sharing proposals in the CPFR operational design materials provided by the company. GLT's scope of direct contracting, independent construction, testing, and operational opening reflects company-confirmed information. The names of customer companies, individuals, product models, and specific execution times were anonymized, and the original data and screens were not publicly attached.
The general CPFR concept is a collaborative process in which supply chain parties coordinate planning, forecasting, and replenishment together. The traditional method of focusing on national sums is a background explanation for this case and does not generalize to the limitations of CPFR as a whole. CPFR concept reference · SAP official explanation
Related tasks: Scope of connection with TMS transportation management · TO Transportation Optimization · Performance comparison and verification standards · Consultation on inventory, order, and shipment tasks for each DC