Features currently available
We compare current facility cost analysis, facility movement/consolidation, new candidate site evaluation, and RDC store/volume adjustment alternatives.

Compare the operating and storage costs and transportation costs of the current facility, as well as alternatives for moving, consolidating, or establishing a new facility and adjusting the store in charge of RDC. The inventory distribution and replenishment policy for each product between CDC and RDC provides advanced design and output examples.
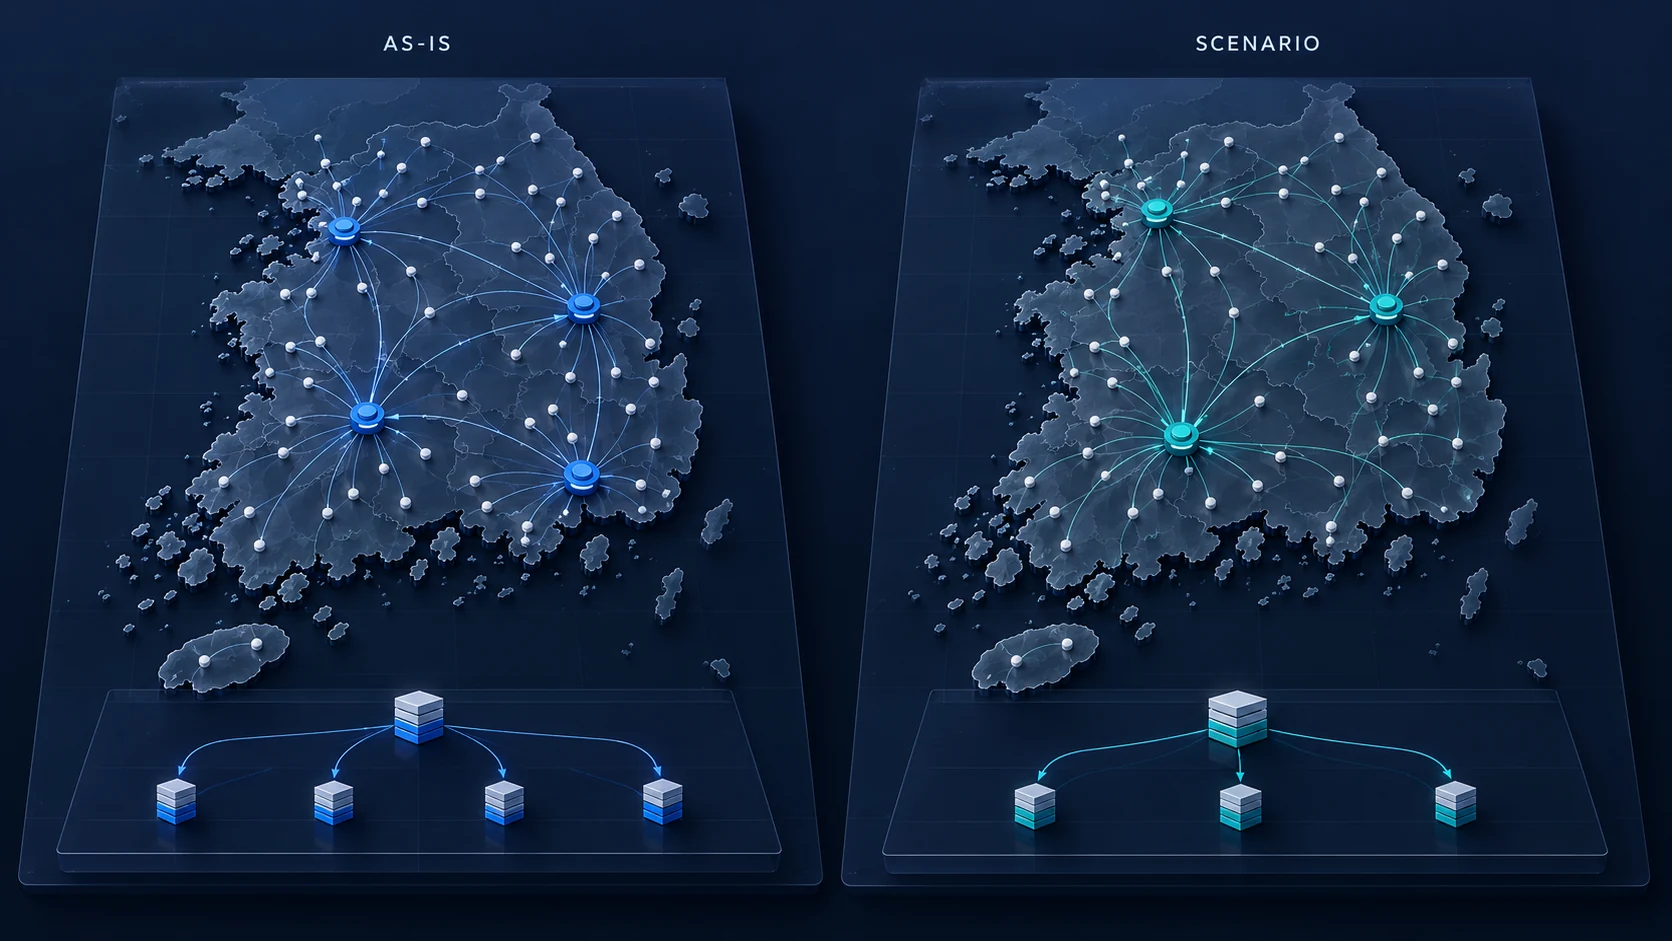
Based on the functions provided by NO, we discuss the scope of connection and advancement for each customer.
We compare current facility cost analysis, facility movement/consolidation, new candidate site evaluation, and RDC store/volume adjustment alternatives.
Connects facility, store, product master, demand, inventory, CAPA and storage and transportation unit price. Supply conditions between CDC and RDC and inventory days and storage volume for each product are defined according to customer-specific analysis standards.
We advance inventory storage facility optimization by exploring storage volume and replenishment policies for each product between CDC and RDC. Define additional cost models and supply and storage constraints, verify them with customer data, and confirm the scope of provision.
Target: ready during November 2026
Currently, we provide scenarios for illustrative purposes only. The actual NO·TO engine experience will be released after connection and verification are completed.
NO Experience Information ↗The provided modules, applicable versions, data/interfaces, and construction scope for each customer are confirmed during introduction consultation.
NO analyzes the volume and cost of the current facility and compares alternatives for facility reorganization. The integrated optimization of inventory distribution and replenishment policies for each product is an area of advancement, and design examples of comparative costs and storage volumes are provided below.
facility/store location, demand volume, center CAPA, storage/operation/main line/delivery unit price
Addition, relocation, consolidation of centers and change of stores in charge. Inventory allocation and replenishment policy confirms the scope of advanced design.
Quantity and cost by region and facility, total logistics cost, map and report
Select application plan by reviewing supply conditions and feasibility together
Basis: G-TO introduction (2026) pages 38~41, 48, 67~69, G-TO·TMS introduction (2025.10) pages 19·33, and GLT NO function description. Individually provided functions and screens are checked according to the applicable version, contract, and scope of connection.
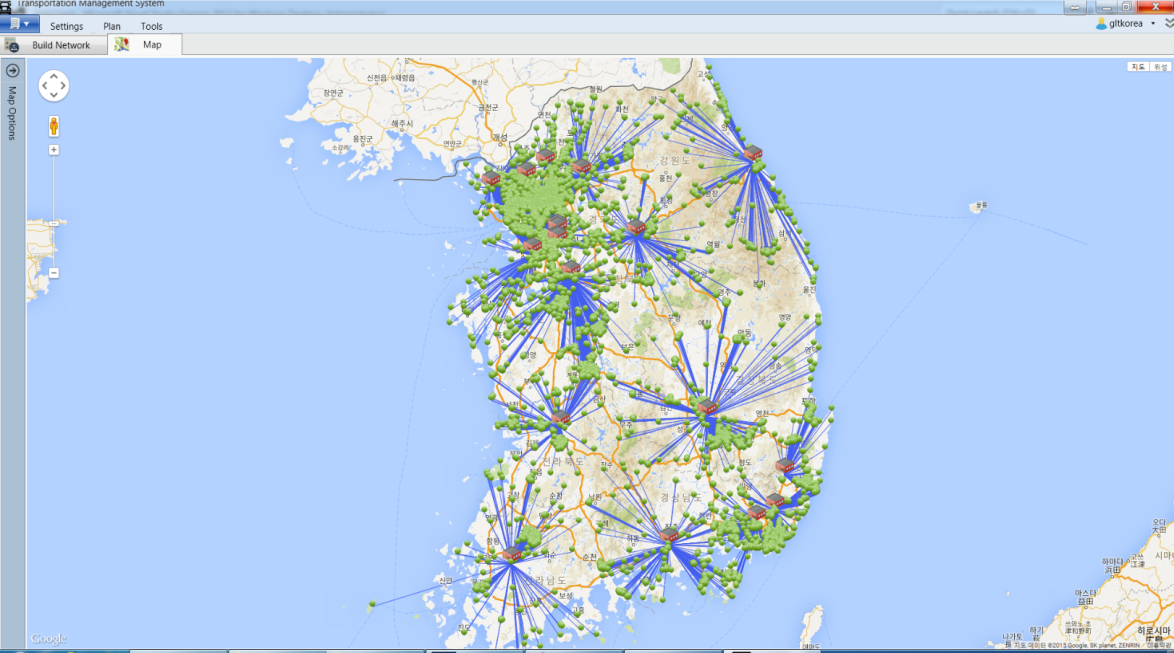
Original Korean source material. See the English explanation on this page.
NO compares the location of the facility and the stores in charge and alternatives for volume, and reviews inventory distribution and replenishment policies for each product as areas of advancement. TO reviews which vehicle and route to transport the order. Connects facility/inventory strategy and transportation execution plan, but both solutions can be executed independently of TMS.
TO Transport Optimization See also ↗Compare alternatives against current costs and see how improvements in one center affect the network as a whole. Integrated optimization of inventory distribution and replenishment policies for each product is an advanced design area.
We calculate the operating and storage costs for each facility and the main line and store delivery transportation costs to create a cost structure and comparison standard for the current network.
Applicable conditionsThe volume of each facility, operation/storage unit price, and trunk/delivery costs are organized on the same basis.
We compare the total logistics cost, cargo volume and processing load by facility, and delivery impact for alternatives such as relocating, consolidating, or closing facilities.
Applicable conditionsThe same demand and cost standards are applied to the current and alternative options, and facility CAPA and supply conditions are reviewed together.
We compare the combination of registered new logistics center candidates with existing facilities to evaluate alternatives that are advantageous in terms of cost and operational effectiveness.
Applicable conditionsPrepare candidate locations, operating conditions, and expected volumes and costs.
We analyze the effects of reallocating responsible stores and volumes between RDCs, and compare changes in overload/idle capacity and transportation costs compared to processing capacity.
Applicable conditionsWe use processing CAPA for each RDC, store in charge, and volume information for each store.
We are enhancing the function to explore the storage amount and replenishment policy for each product between CDC and RDC. The direction is to evaluate storage costs, additional trunk costs, handling costs, and supply constraints together.
Applicable conditionsPrepare inventory days and storage volume for each product, storage unit price for each facility, and trunk supply conditions.
These are the data and result items to prepare when negotiating the scope of analysis. Detailed fields, units, API specifications and support conditions are provided for each applicable version.
| analysis area | review data | Results to check |
|---|---|---|
| Current Cost Analysis | facility location/volume of cargo, operation/storage unit price, main line/delivery transportation cost | Cost structure by facility, total network logistics cost, alternative comparison criteria |
| facility reorganization | Movement/integration/closure alternatives, demand volume, facility CAPA and supply conditions | Changes in cost compared to current, impact on volume, load and delivery by facility |
| Evaluation of new candidate sites | Candidate location, operating conditions, expected cost, existing facility and demand information | Costs and operational effects by combination of candidate sites and existing facilities |
| Coordination of stores in charge of RDC | CAPA by RDC, store location/volume, current responsible facility and transfer plan | Quantity distribution before and after store transfer, overload/idle capacity and transportation costs |
| Inventory placement and advanced design for each product | CDC/RDC information, inventory days/storage amount by product, storage unit price/main supply cost | Design example: average/peak storage amount/replenishment amount for each product, cost comparison, and constraint verification items |
Distribution, commerce, and franchises that operate multiple CDCs, RDCs and stores, manufacturers with multiple factories and centers, and 3PLs and 4PLs that perform facility operations and network design.
We compare operating costs that can be reduced by integrating adjacent RDCs with trunk and delivery costs that can increase.
Some stores in RDC that lack CAPA will be transferred to nearby facilities to review the capacity of existing facilities and transportation impacts.
An advanced scenario examines CDC storage of long-term inventory and RDC supply. In the example of cost and storage amount of home data, you can check storage cost reduction, additional trunk cost and handling cost, and verification conditions.
We are reviewing the alternative of placing long-term storage in the CDC, which acts as a hub, and placing supplies that require quick supply in the RDC. This is not an advantageous arrangement if storage costs are reduced but replenishment transportation costs are higher.
Below is an example of output calculated directly from hypothetical data. These are not actual customer cases or results of running the current GA engine. The ability to explore storage volume and replenishment policies for each product confirms the scope of provision after upgrading and verifying customer data.
Average storage volume for all products
Focus on long-term and buffer inventory
↓ CDC → RDC monthly supplement 1,200PLT
Inventory for short-term supply
CDC is a central logistics center and RDC is a regional logistics center. PLT is a pallet equivalent, here we keep the average storage amount totaling 1,000 PLT. Monthly replenishment is the volume that moves during a period and is different from average inventory.
Divide roles for each product according to average demand and replenishment conditions. For products that need to be shipped quickly or supplied immediately, we also compare plans to keep them in RDC.
The table can be moved left or right to view all items.
| Product group | Average daily shipment PLT/day | Current RDC Average PLT | Alternative CDC Average PLT | Alternative RDC Average PLT | CDC → RDC PLT/month | Assumptions in Placement Judgment |
|---|---|---|---|---|---|---|
| A · Long-term storage type | 10 | 600 | 540 | 60 | 300 | Of the total average inventory of 60 days, 6 days' worth is maintained in RDC. |
| B · Medium rotation type | 30 | 300 | 180 | 120 | 900 | Of the total average inventory of 10 days, 4 days' worth is maintained in RDC. |
| C · Immediate supply type | 50 | 100 | 0 | 100 | 0 | Maintain 2-day supply at RDC and continue direct supply |
| total | 90 | 1,000 | 720 | 280 | 1,200 | Total average inventory is the same |
A·B assumes that CDC replenishes the average daily shipment × 30 days, and C maintains the existing direct supply. A's RDC inventory of 60PLT is enough to cover 6 days of average demand, and B's 120PLT is enough to cover 4 days of average demand. These figures alone do not demonstrate that safety stocks or target service levels have been met.
| Compare items | current | alternative | Difference·Alternative−Current |
|---|---|---|---|
| CDC storage fee | 0 | 1,080 | +1,080 |
| RDC storage fee | 3,600 | 1,008 | -2,592 |
| Net increase in trunk cost | 0 | 720 | +720 |
| Additional handling fee | 0 | 240 | +240 |
| Comparison range total | 3,600 | 3,048 | −552 |
Reduction in storage costs by KRW 15.12 million − additional trunk costs by KRW 7.2 million − additional handling costs by KRW 2.4 million.
This is 15.3% of the comparative range cost and does not represent actual savings or overall network cost savings.
The net increase in main line unit cost is the additional cost minus the replacement/reduced cost from the existing supply route. Additional handling costs were assumed to be the sum of the increased operating costs per PLT of replenishment. The same final shipping costs, fixed costs, capital costs, etc. are excluded from the table above, and if new fixed costs, initial transfer costs, or increases or decreases in inventory occur, they must be included separately. The actual main route cost is calculated based on the number of trips, vehicle type, loading rate, and minimum fare.
Even though storage costs are low, CDC is not always advantageous. In this assumption, if the net increase in main line price is 10,600 won/PLT, the savings is 0. If this is exceeded, the comparative cost, including additional handling fees, will be greater than the current price.
We match demand/inventory history/volume/temperature range/expiration date for each product, storage/stock/delivery CAPA for each facility, and freight rates and replenishment lead time for each route.
Check peak inventory/peak throughput, replenishment cycle/minimum shipment quantity, delivery time, and defect tolerance criteria. We do not determine CAPA or availability based on average inventory alone.
Compare average/peak storage volume, replenishment volume/frequency, cost composition, and violation of restrictions by product/facility. The person in charge reviews the results and decides on an action target.
The direction is to construct storage facilities, distribution amounts, and replenishment policies for each product as candidate proposals, and evaluate and explore storage, transportation, and handling costs. Plans that violate CAPA, delivery, and product constraints are designed to be excluded from execution candidates. Since GA is not a method that guarantees a global optimal solution, the application is judged through repeated execution, comparison with the current one, and separate constraint verification.
Design Note: Research on GA-based facility/distribution model ↗ · Multi-tier inventory optimization study considering service constraints ↗. The experimental results of the study do not imply GLT product performance.
From data preparation to existing system connection, result review and introduction procedures. This is a frequently asked question when determining the right coverage for your business.
NO introduction consultation ↗Prepare facility/store locations, demand volume, center processing capacity (CAPA), and operation/storage/trunk/delivery unit costs. To compare storage facilities for each product, add inventory days, storage amount, and CDC/RDC supply conditions.
NO Information on data and results for each analysisFrom available data, you can check the current cost structure and any missing items. We organize the basis for the unit, period, and estimated values together, agree on the scope of interpretation of the comparison results, and then analyze them.
Check data and determine verification scopeYes. You can start by reviewing the cost analysis of existing facilities or adjusting the stores and volumes in charge of RDC. In the stage of comparing new candidate sites, candidate site conditions such as location, CAPA, and operating costs are separately prepared.
Case of facility/region reorganizationCompare the volume and CAPA of each facility to check overload and idle capacity. We look at the transportation costs and supply impacts of store transfer and regional adjustment alternatives, and review applications that fit operational constraints.
Review Items for RDC Quantity AnalysisIt is judged based on a comparison table that subtracts additional trunk and handling costs from storage cost savings. The integrated exploration of storage volume and replenishment policies for each product is an area of advancement, and we currently provide examples of output calculated using assumed data and verification conditions.
Example of storage facility/volume and cost comparisonWe review the scope of utilizing facility, demand, inventory, and cost data from the existing system as analysis input. Match the code, unit, and standard period and determine the data extraction method and update cycle according to the scope of linkage.
Data consistency and system linkage proceduresThe same demand, period, cost units and supply conditions apply. In addition to reducing storage and operating costs, we compare total logistics costs, including increased trunk and delivery costs and load by facility.
Standard for comparing results under the same conditionsWe organize the current network and cost standards, agree on comparison scenarios, and verify the results. The scale of facility, store, and product, the complexity of the cost model, the number of scenarios, and the scope of system connection determine the schedule and cost.
Introduction procedure and factors determining period and costPlease tell us your current facility and any changes you are considering. Compare cost, volume, CAPA and analysis scope together.
Please choose a situation that is close to our company.
Even if you don't have any data yet, you can tell us about your current situation. Information that is difficult to disclose may be reviewed as a sample with identifying information masked.
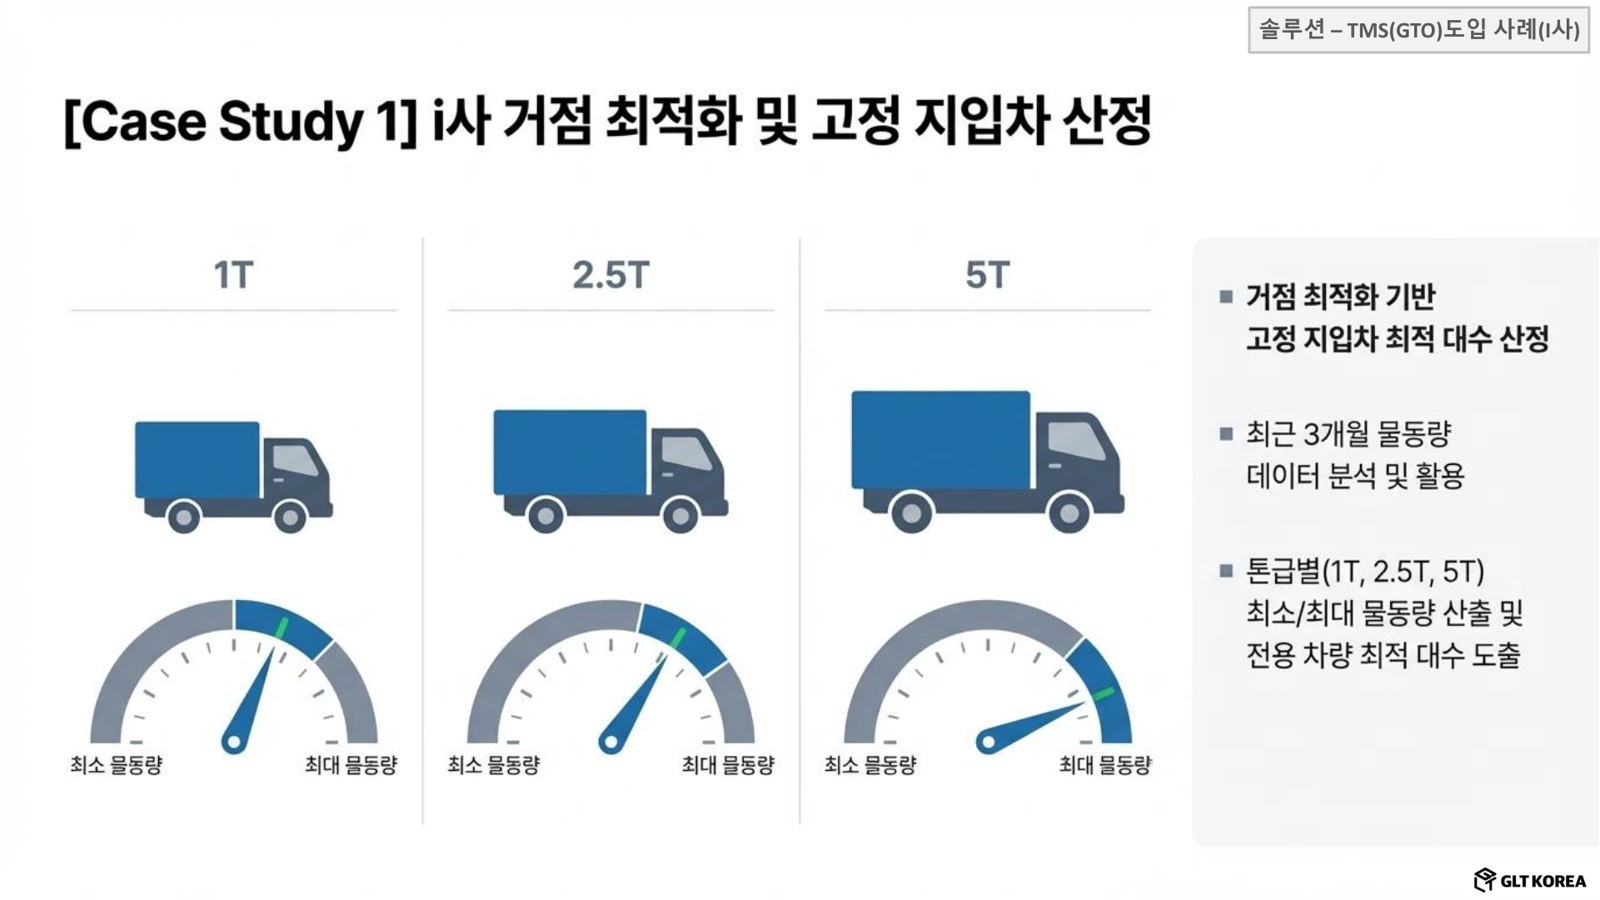
A fleet planning case comparing daily orders and vehicle costs to evaluate the mix of dedicated and hired vehicles. The source describes the 30-day simulation assumptions and recommended fleet size.
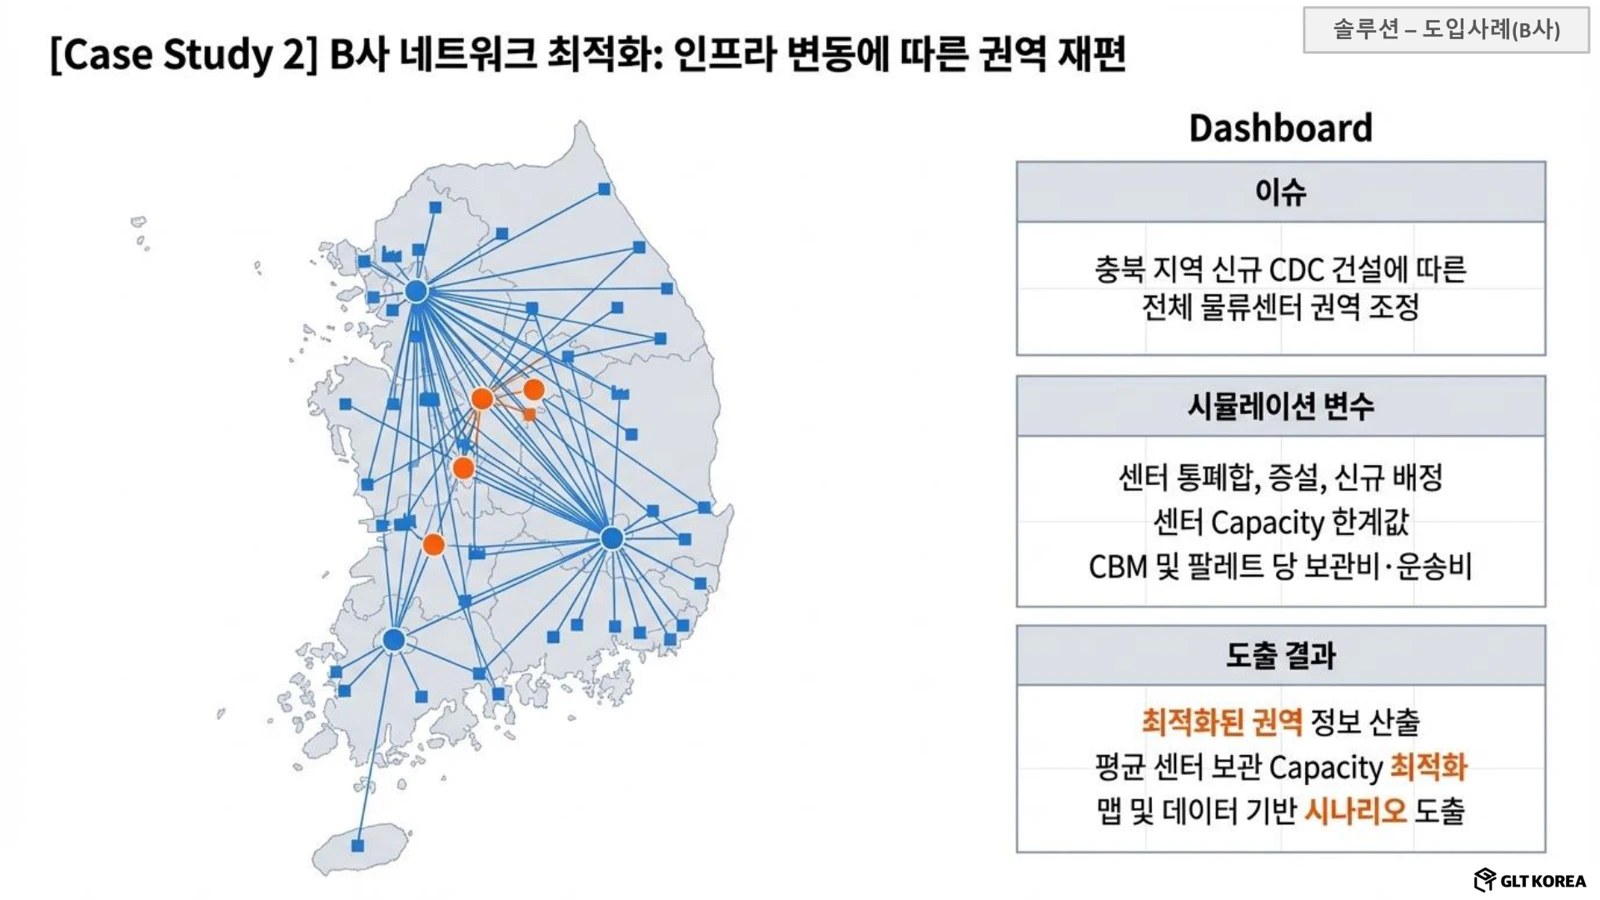
Learn More ↗A case from GLT’s solution materials comparing each facility’s volume, capacity, storage and transport costs while reallocating territories around a new CDC.
Learn More ↗The data and outputs needed to assess current costs, facility redesign, candidate sites, RDC volumes and product-level inventory placement.
Learn More ↗A 44-slide PowerPoint covering TMS project experience, optimization functions, transport and network simulation, and screenshots of earlier implementations.
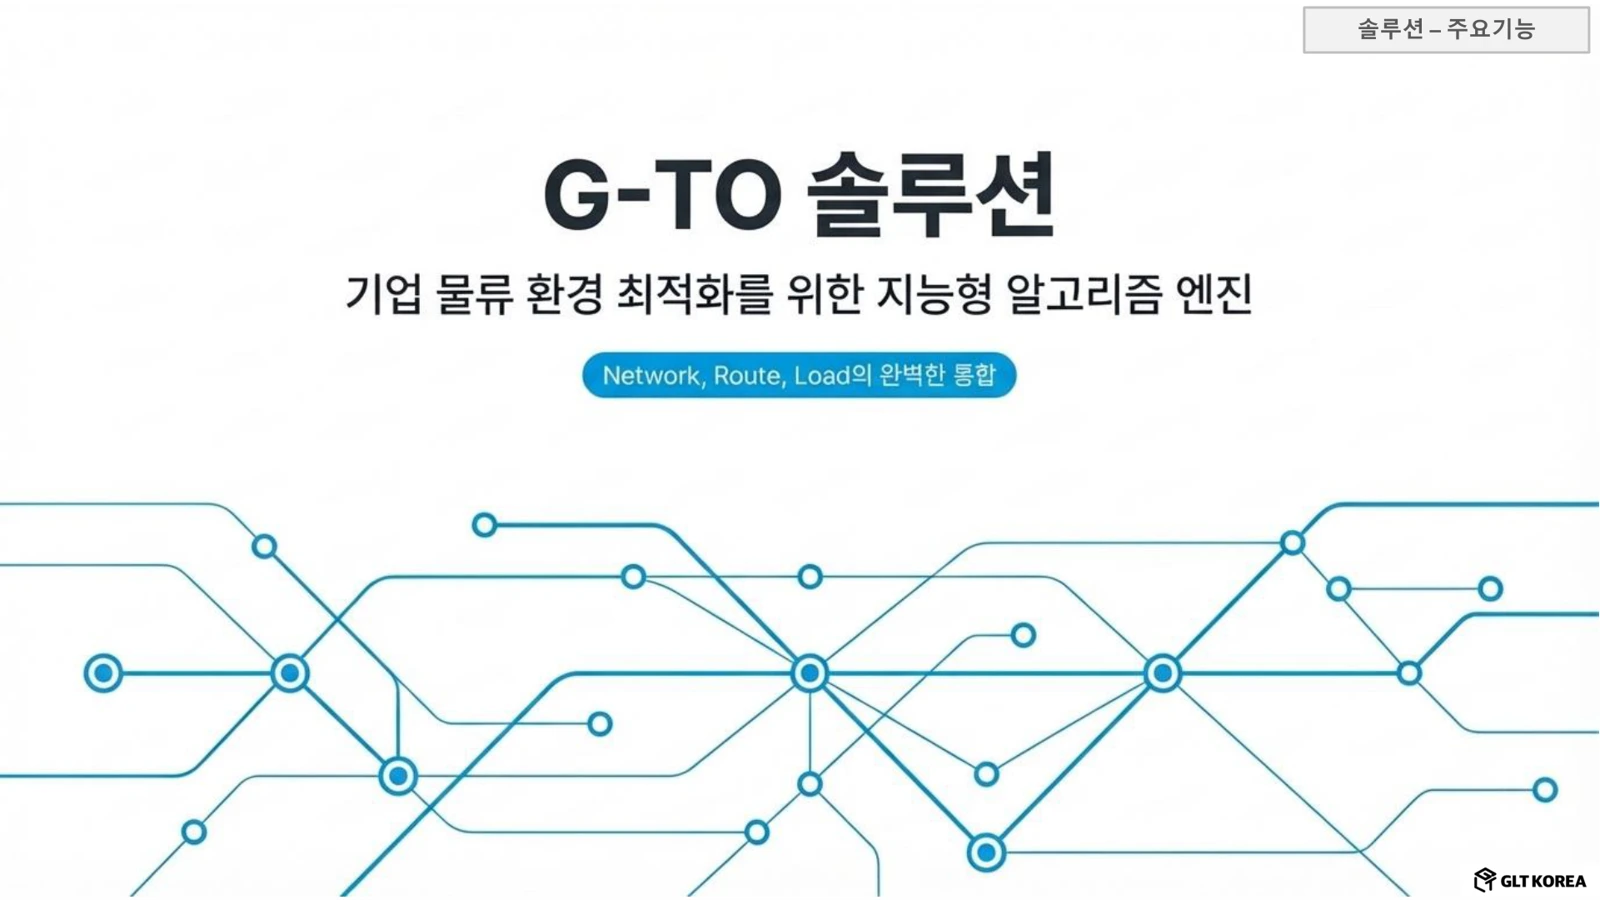
Learn More ↗An 85-page PDF introducing G-TO’s TO, NO, Route and Load Build functions, application architecture and GLT project examples.
Learn More ↗The deliverables and factors that shape schedule and cost at each stage: data review, comparative validation, system integration and operational rollout.
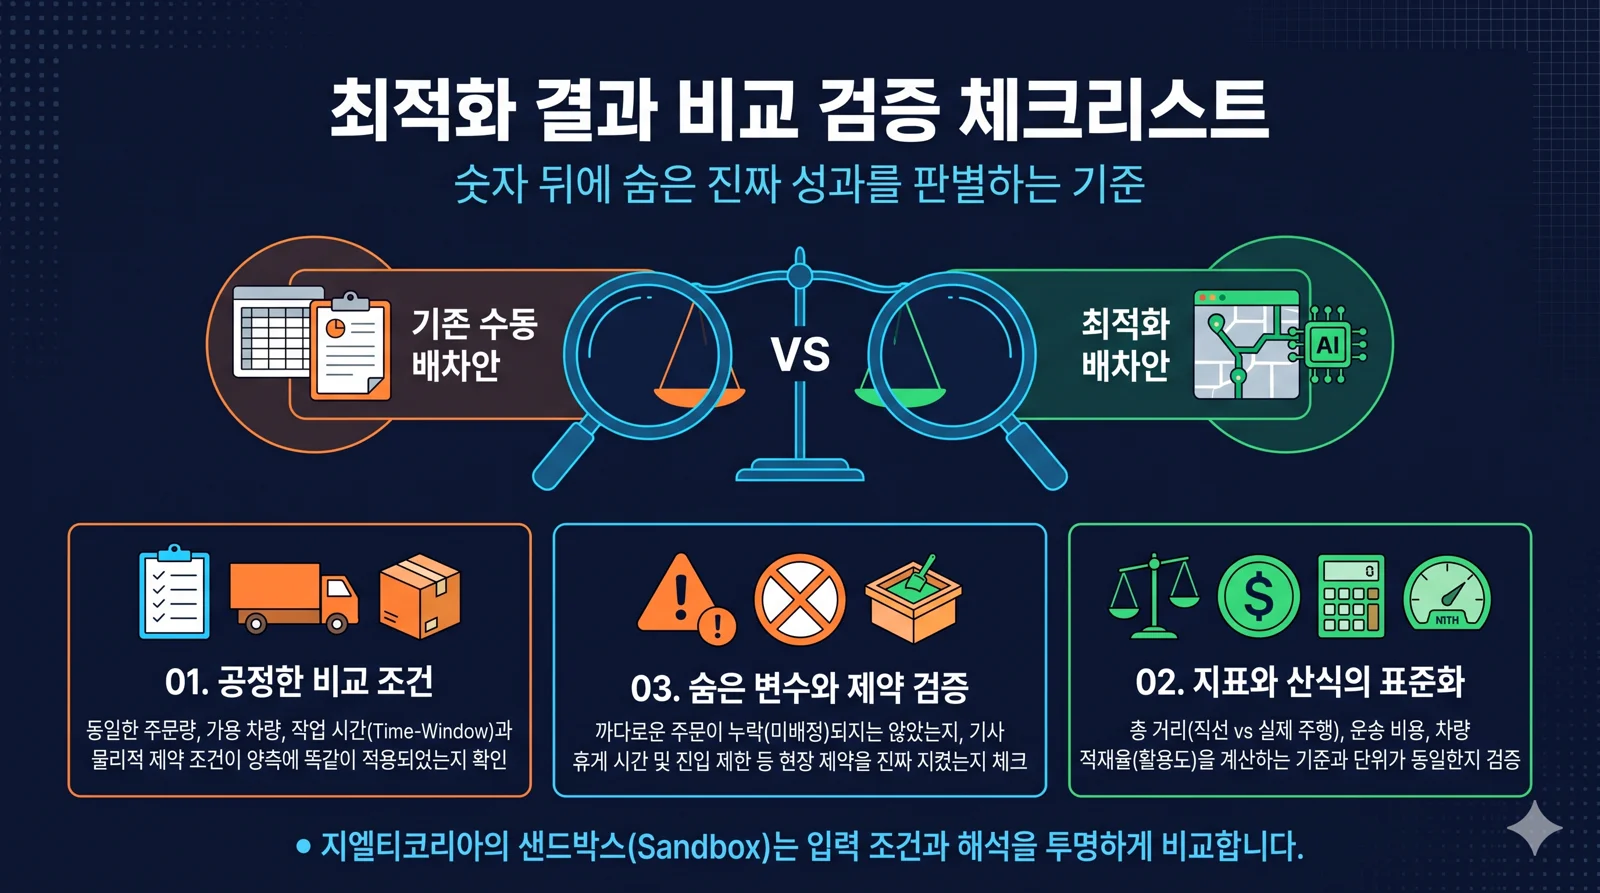
Learn More ↗A practical guide to input conditions, metric formulas, constraint compliance, execution environments and measured operational results.
Learn More ↗Understand the roles of NO, TO and TMS, and how to prepare order, delivery point, vehicle and transport requirement data before implementing dispatch optimization.
Learn More ↗